Graphics cards/Comparison
13 specifications
NVIDIA GeForce RTX 2080 vs AMD Radeon RX 5700 XT
On paper, the NVIDIA GeForce RTX 2080 has more shading units. Specifications describe what each card is designed to do; how much of that either one holds under continuous load is a separate question.
NVIDIA GeForce RTX 2080
NVIDIA · GeForce RTX 20 · Desktop
AMD Radeon RX 5700 XT
AMD · Radeon RX 5000 · Desktop
Compute
Memory
Power and platform
A check marks the higher figure only on rows where higher is unambiguously better. Rows without one are not ties; they are specifications where “better” has no meaning.
Reading the table
What the difference means.
A year apart
The RX 5700 XT (Radeon RX 5000, 2019) is a year newer than the RTX 2080 (Turing, 2018). A newer architecture brings more than speed: newer video encoders and decoders, newer upscaling and frame generation, and a longer run of driver updates ahead of it.
Video memory
Both carry 8 GB, so neither has the advantage where memory is the limit: high resolutions, heavy textures and local AI models fill both at the same point.
Shading units
The counts differ, 2,944 against 2,560, but these are different designs from different makers, and a shading unit on one is not the same amount of work as on the other. The row cannot be used to rank this pair.
Board power
Both are rated at 225 W, so they ask the same of a case and a power supply.
What no table says
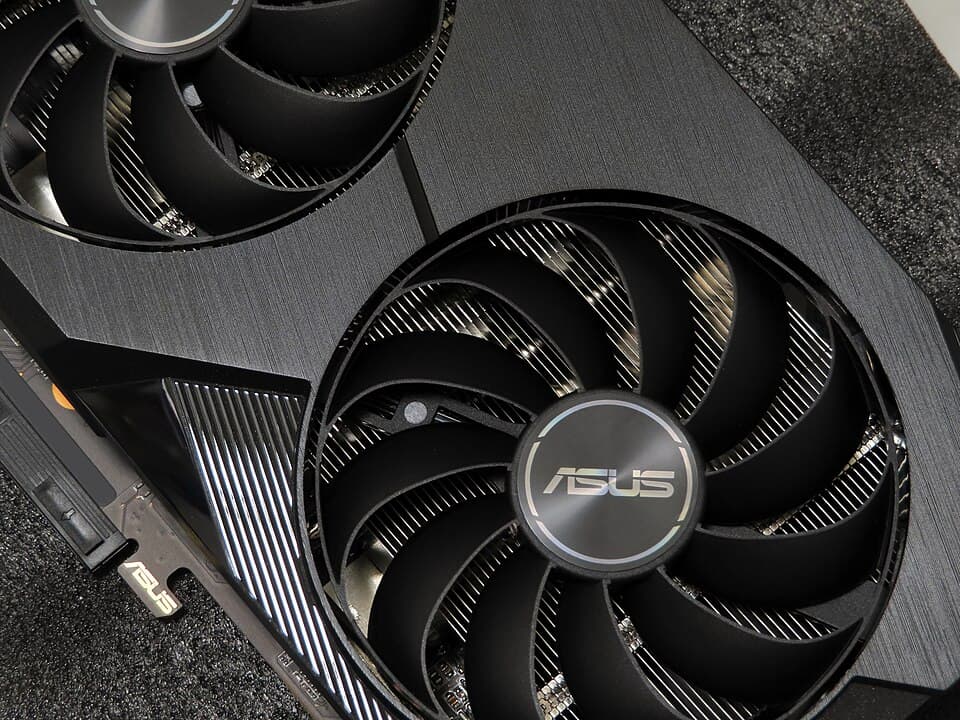
How much of its speed a graphics card keeps after the first minute depends on the cooling and the power limit of the machine it is in. If you own one of these, measure it: the test is free and runs in this browser.
Questions
- Is the RTX 2080 better than the RX 5700 XT?
- On the specifications they are closely matched. They are different designs, so the raw counts cannot rank them. Frame rates depend on the game and its settings, and how much speed either card keeps after ten minutes depends on its cooling, which is what a sustained test measures.
- Can the RTX 2080 and the RX 5700 XT be compared on these figures alone?
- Only in part. They are different designs, so counts such as shading units do not convert one to one. Running the same sustained graphics test on each machine gives a figure that can be compared directly.
More comparisons
- NVIDIA GeForce RTX 2080 vs AMD Radeon RX Vega 56
- NVIDIA GeForce RTX 2080 vs NVIDIA GeForce RTX 2070 SUPER
- NVIDIA GeForce RTX 2080 vs AMD Radeon RX Vega 64
- NVIDIA GeForce RTX 2080 vs AMD Radeon RX 6600
- NVIDIA GeForce RTX 2080 vs NVIDIA GeForce RTX 3060 8GB
- AMD Radeon RX 5700 XT vs AMD Radeon RX Vega 56
- AMD Radeon RX 5700 XT vs NVIDIA GeForce RTX 2070 SUPER
- AMD Radeon RX 5700 XT vs AMD Radeon RX Vega 64
- AMD Radeon RX 5700 XT vs AMD Radeon RX 6600
- AMD Radeon RX 5700 XT vs AMD Radeon RX 5700
Every figure on this table is a design target. None of it is a measurement.
Nothing above describes how a graphics card behaves twenty minutes into a sustained workload, which is where two chips with nearly identical specifications routinely diverge. A boost clock is a ceiling the vendor permits, not a rate the chip sustains, and whether it holds depends on the cooling, the case, the power profile and the room. None of those appear on a specification sheet.
We deliberately do not reduce these figures to a single score. A composite invented from specifications would look authoritative and measure nothing, and choosing the weights would be choosing the winner.